Information panel in the C-Monitor client
The information panel fulfills its task to mediate the user of selected information gathered by the C-Monitor client and it simplifies launching of scheduled tasks.
Launch of the information panel
Overview of information in the Information panel
Management of data on the information panel
States of scheduled tasks in the information panel
Launch of the information panel
Information panel is launched through Tray menu of the C-Monitor icon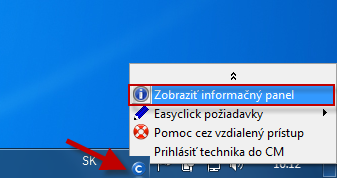
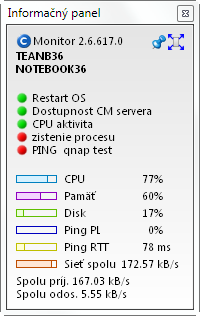
Overview of information in the Information panel
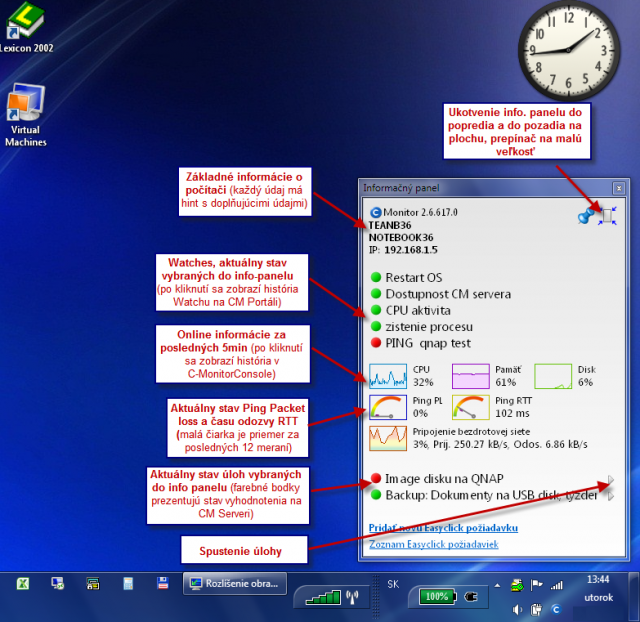
CM-ID
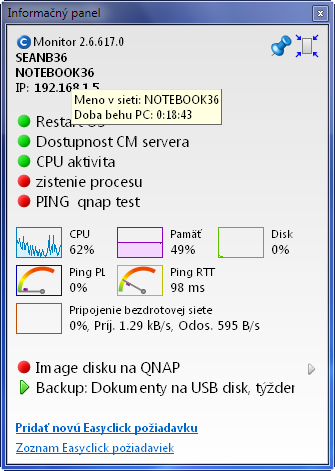
Network name of the computer - hint: Uptime of the computer
Current IP address - hint: name of the network adapter, default GW
Current state of Watches - hint : conditions, click to redirect to history of Watches on CM portal. Which watches are displayed in the information panel is adjusted through C-MonitorConsole, in configuration of Watches
CPU load during the last 5 min in 30 sec intervals
Occupation of physical RAM during the last 5 min in 30 sec intervals
Load of drives (joint average) during the last 5 min in 30 sec intervals
Percentage of Packet Loss and response time (RTT) from ping to a defined IP address (defaultly it's google.sk). How to change the ping address can be found below in the article.
Graphic display for Packet Loss is :
Pure green is from 0-3% PL
Transition to yellow is from 3-10% PL
Transition to red is from 10 - 20% PL
Pure red is from 20%-40% PL
Out of range is from 40-46% PL
Graphic display for response time RTT is :
Pure green is from 0-30ms RTT
Transition to yellow is from 30-100ms RTT
Transition to red is from 100 - 200ms RTT
Pure red is from 200ms-400ms RTT
Out of range is from 400-466ms RTT
Load of active network adapters during the last min, y-axis is in kB/sec, maximum displayed value is 200kB/sec
Selected scheduled tasks with status and button for manual launch - there's a state displayed for the tasks, which is described below in the article.
Control links to enter and view Easyclick requests
Management of data on the information panel
On the information panel, you can adjust :
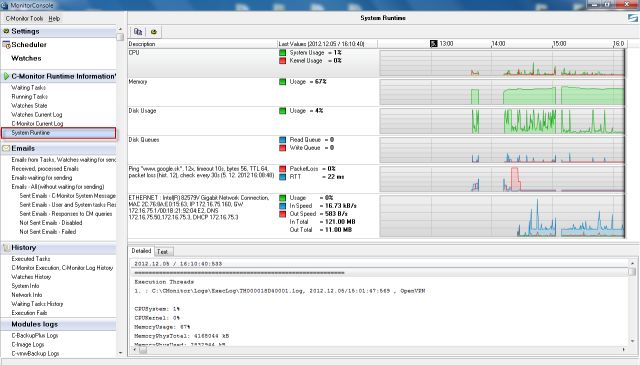
List of Watches - display is defaultly ENABLED, display settings are in the current CM version only directly from the computer through C-MonitorConsole, in the Watch's configuration.
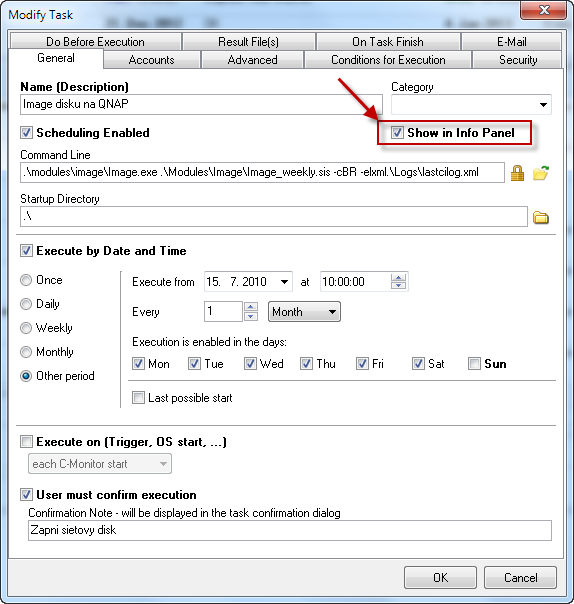
List of scheduled tasks - display is defaultly DISABLED, display settings are in the current CM version only directly from the computer through C-MonitorConsole, in the Scheduled task's configuration.
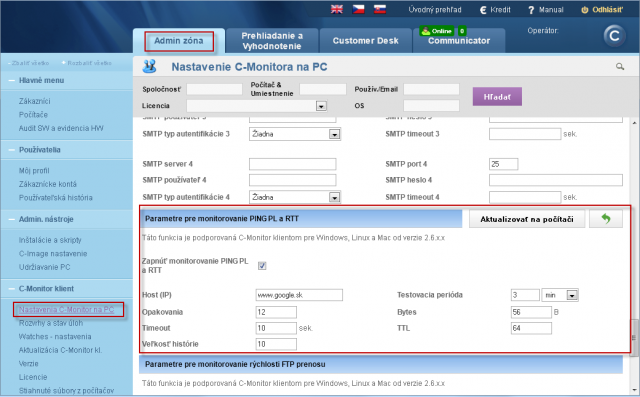
IP address for measuring Ping Packet Loss and RTT to Online information. Ping is defaultly to Google website. Changes are made on CM Portal at Admin zone -> C-Monitor client -> C-Monitor settings on PC -> "computer" -> section Parameters for monitoring of PING PL and RTT
FTP short test within Online information - the test is launched through CM portal at Presentation and Evaluation -> Online information -> "computer" -> link Launch FTP test

States of scheduled tasks in the information panel
Colored dot - is state of an error to the given task evaluated on CM Server. It's only available for certain tasks, for example backups. Color meanings :
Green - state OK
Yellow-orange - Warning
Pink - Alarm
Red - Critical alarm
Green check mark - state OK (evaluated by C-Monitor based on Exit code in the tab On task finish). Default value of a successful completion is Exit code =0.
Exclamation mark in a yellow triangle - Warning state (evaluated by C-Monitor according to Exit code). Either was the scheduled task not launched at all within an expected interval, or the recently launched task was not successful.
Exclamation mark in a red circle - critical error. The task cannot be launched, for instance the signature to an .exe file is missing, or a required configuration file etc. The reparations are usually performed by an operator.


